
Graph Engineering
How many AI agents connect and work as a team.
Graph engineering is the skill of planning how several AI agents connect so they can finish one big job together, instead of asking one AI to do everything alone. It matters for freelancers and VAs because many modern AI tools (like deep research features) quietly use dozens of agents behind the scenes, and knowing this helps you understand why some tasks are faster, slower, or more expensive than others.
What is graph engineering?
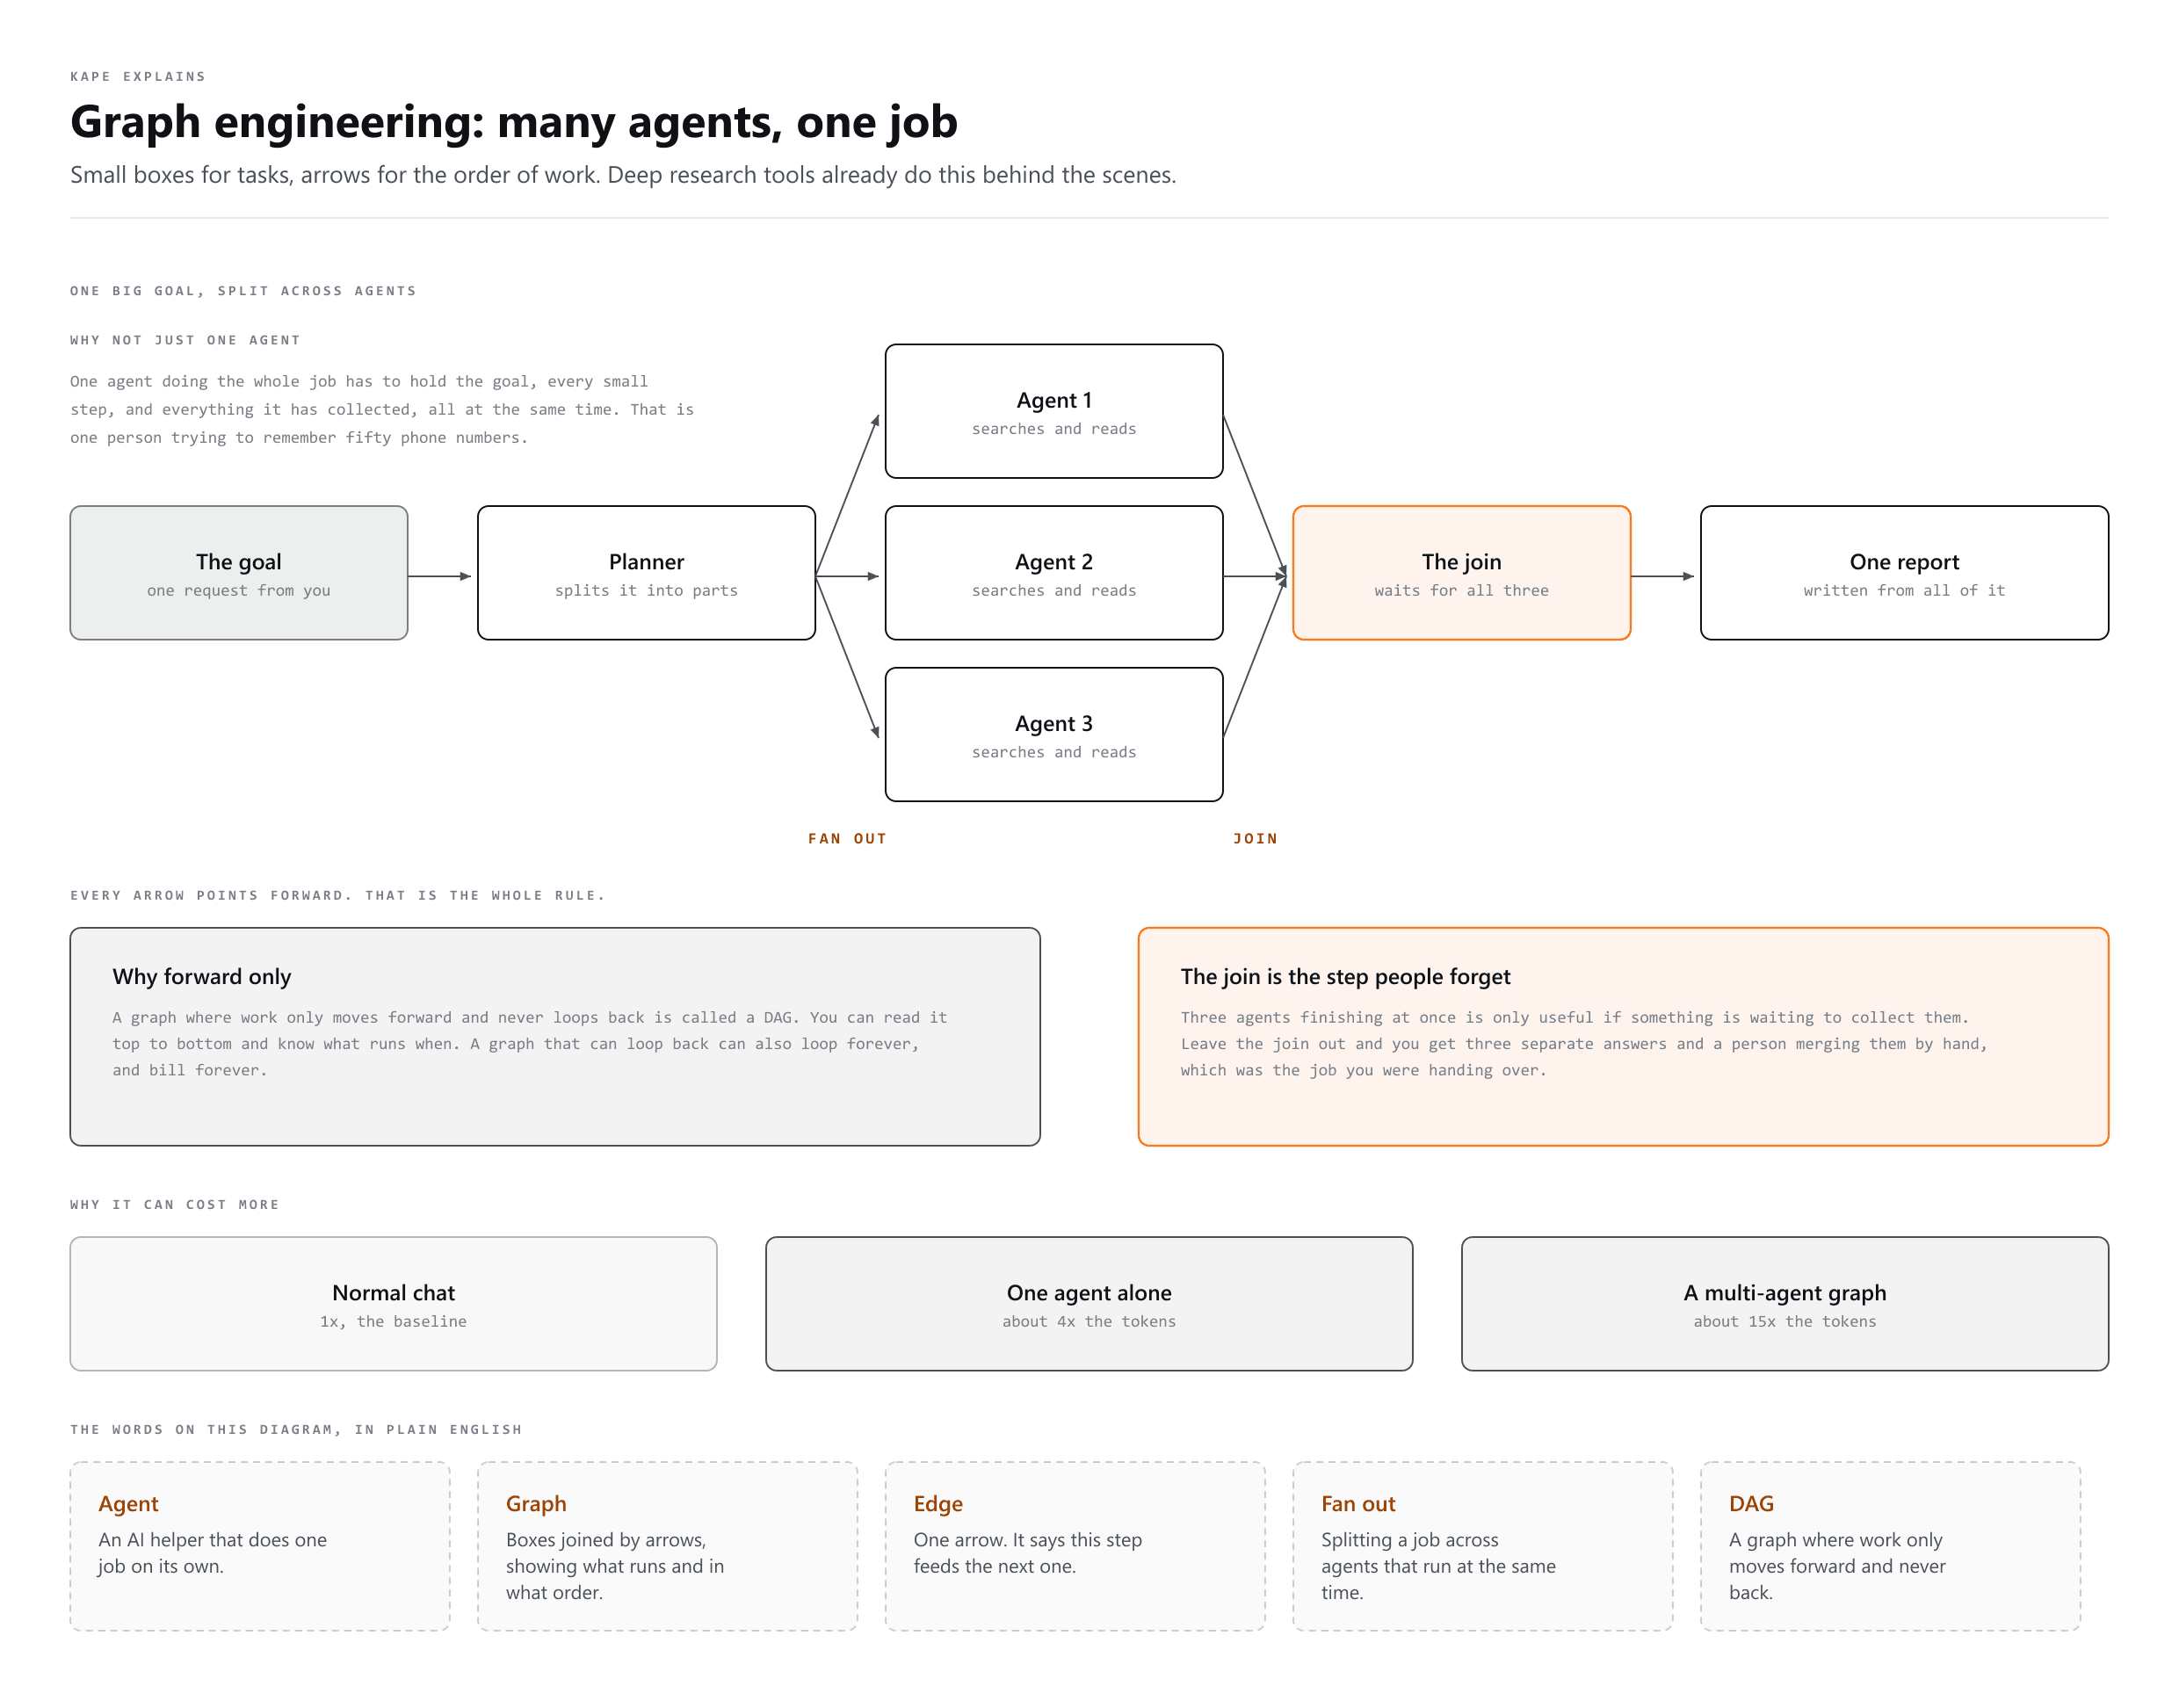
Graph engineering is the work of planning how many AI agents connect to each other so they can finish one big task together. Instead of asking one AI to do everything by itself, you break the job into smaller pieces. Each piece is handled by its own agent. Then you draw lines between the pieces to show which one happens first, which one happens next, and which ones can happen at the same time. That plan of dots and lines is what people call a graph.
The problem it solves
Before graphs, most AI tools used one single agent to handle a whole task from start to finish. That one agent had to remember everything at once: the goal, the small steps, and all the information it collected along the way. For a big task, like researching a topic across many sources, this gets slow and messy. One agent trying to hold everything in its head is like one person trying to remember fifty phone numbers at the same time. Splitting the work between many focused agents, connected in a graph, solves this problem.
How it works
- Someone gives the AI system a big goal, such as 'research this topic and write a report.'
- One agent reads the goal and breaks it into smaller sub-tasks.
- Several agents are each given one sub-task, and they work at the same time.
- Each agent finishes its own small task and passes the result along the connecting line, called an edge.
- A later agent checks the results, and a final agent puts everything together into one answer.
A worked example
Picture a deep research task. First, one agent reads the request and decides what needs to be looked into. Then a group of agents go find good sources on different parts of the topic. After that, a bigger group of agents actually reads those sources and pulls out useful facts. Another group checks whether the facts can be trusted. Finally, one agent takes everything gathered and writes it into a single, clear report. Every arrow between these groups only points forward, from one step to the next, never backward. A graph shaped this way, where work only flows in one direction, is called a DAG, short for directed acyclic graph.
Three shapes, and that is most of it
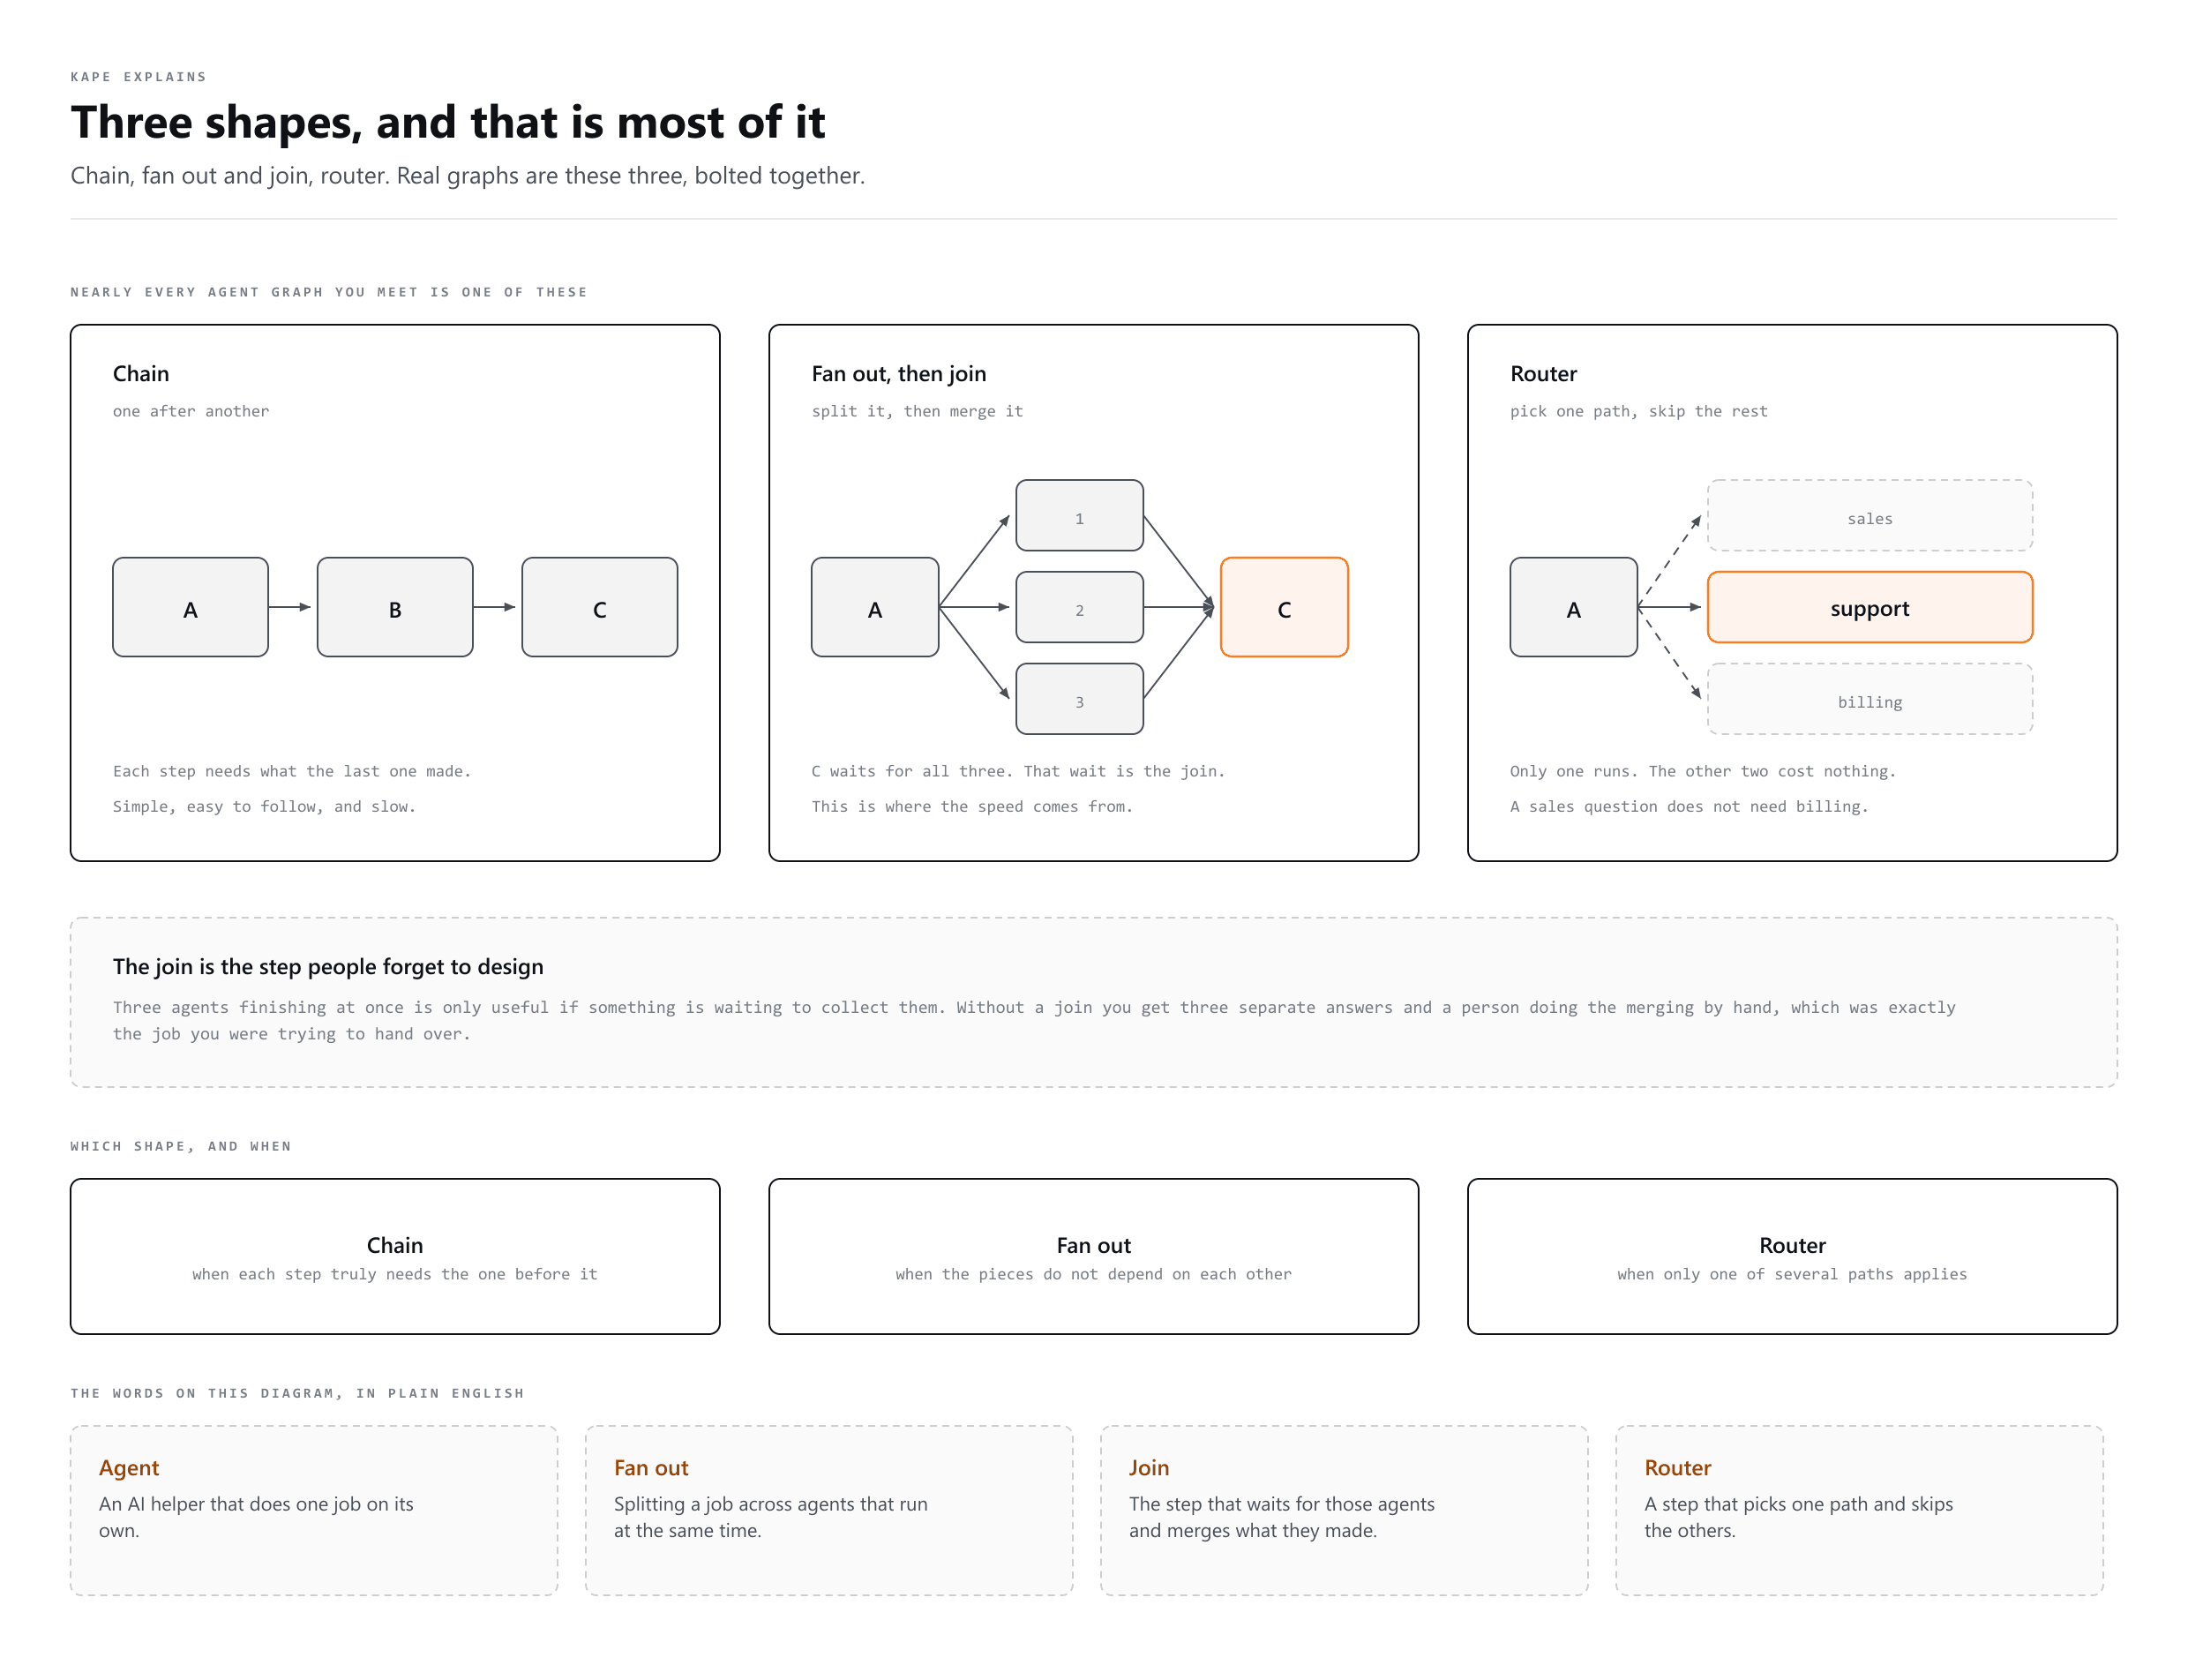
- Chain. One after another, because each step needs what the last one produced. Slow, simple, easy to follow.
- Fan out, then join. Split the work, run the pieces at the same time, then merge them. This is where the speed comes from.
- Router. Look at the request, pick one path, skip the rest. A sales question and a billing question do not need the same five agents.
When one agent in the middle is wrong
Work only flows forward. That is the shape's strength and its one real weakness: nothing behind a mistake can correct it. If the third agent reads last year's price, the fourth treats that number as a fact, the writer puts it in a sentence, and what reaches you is a confident report with a wrong figure inside it.
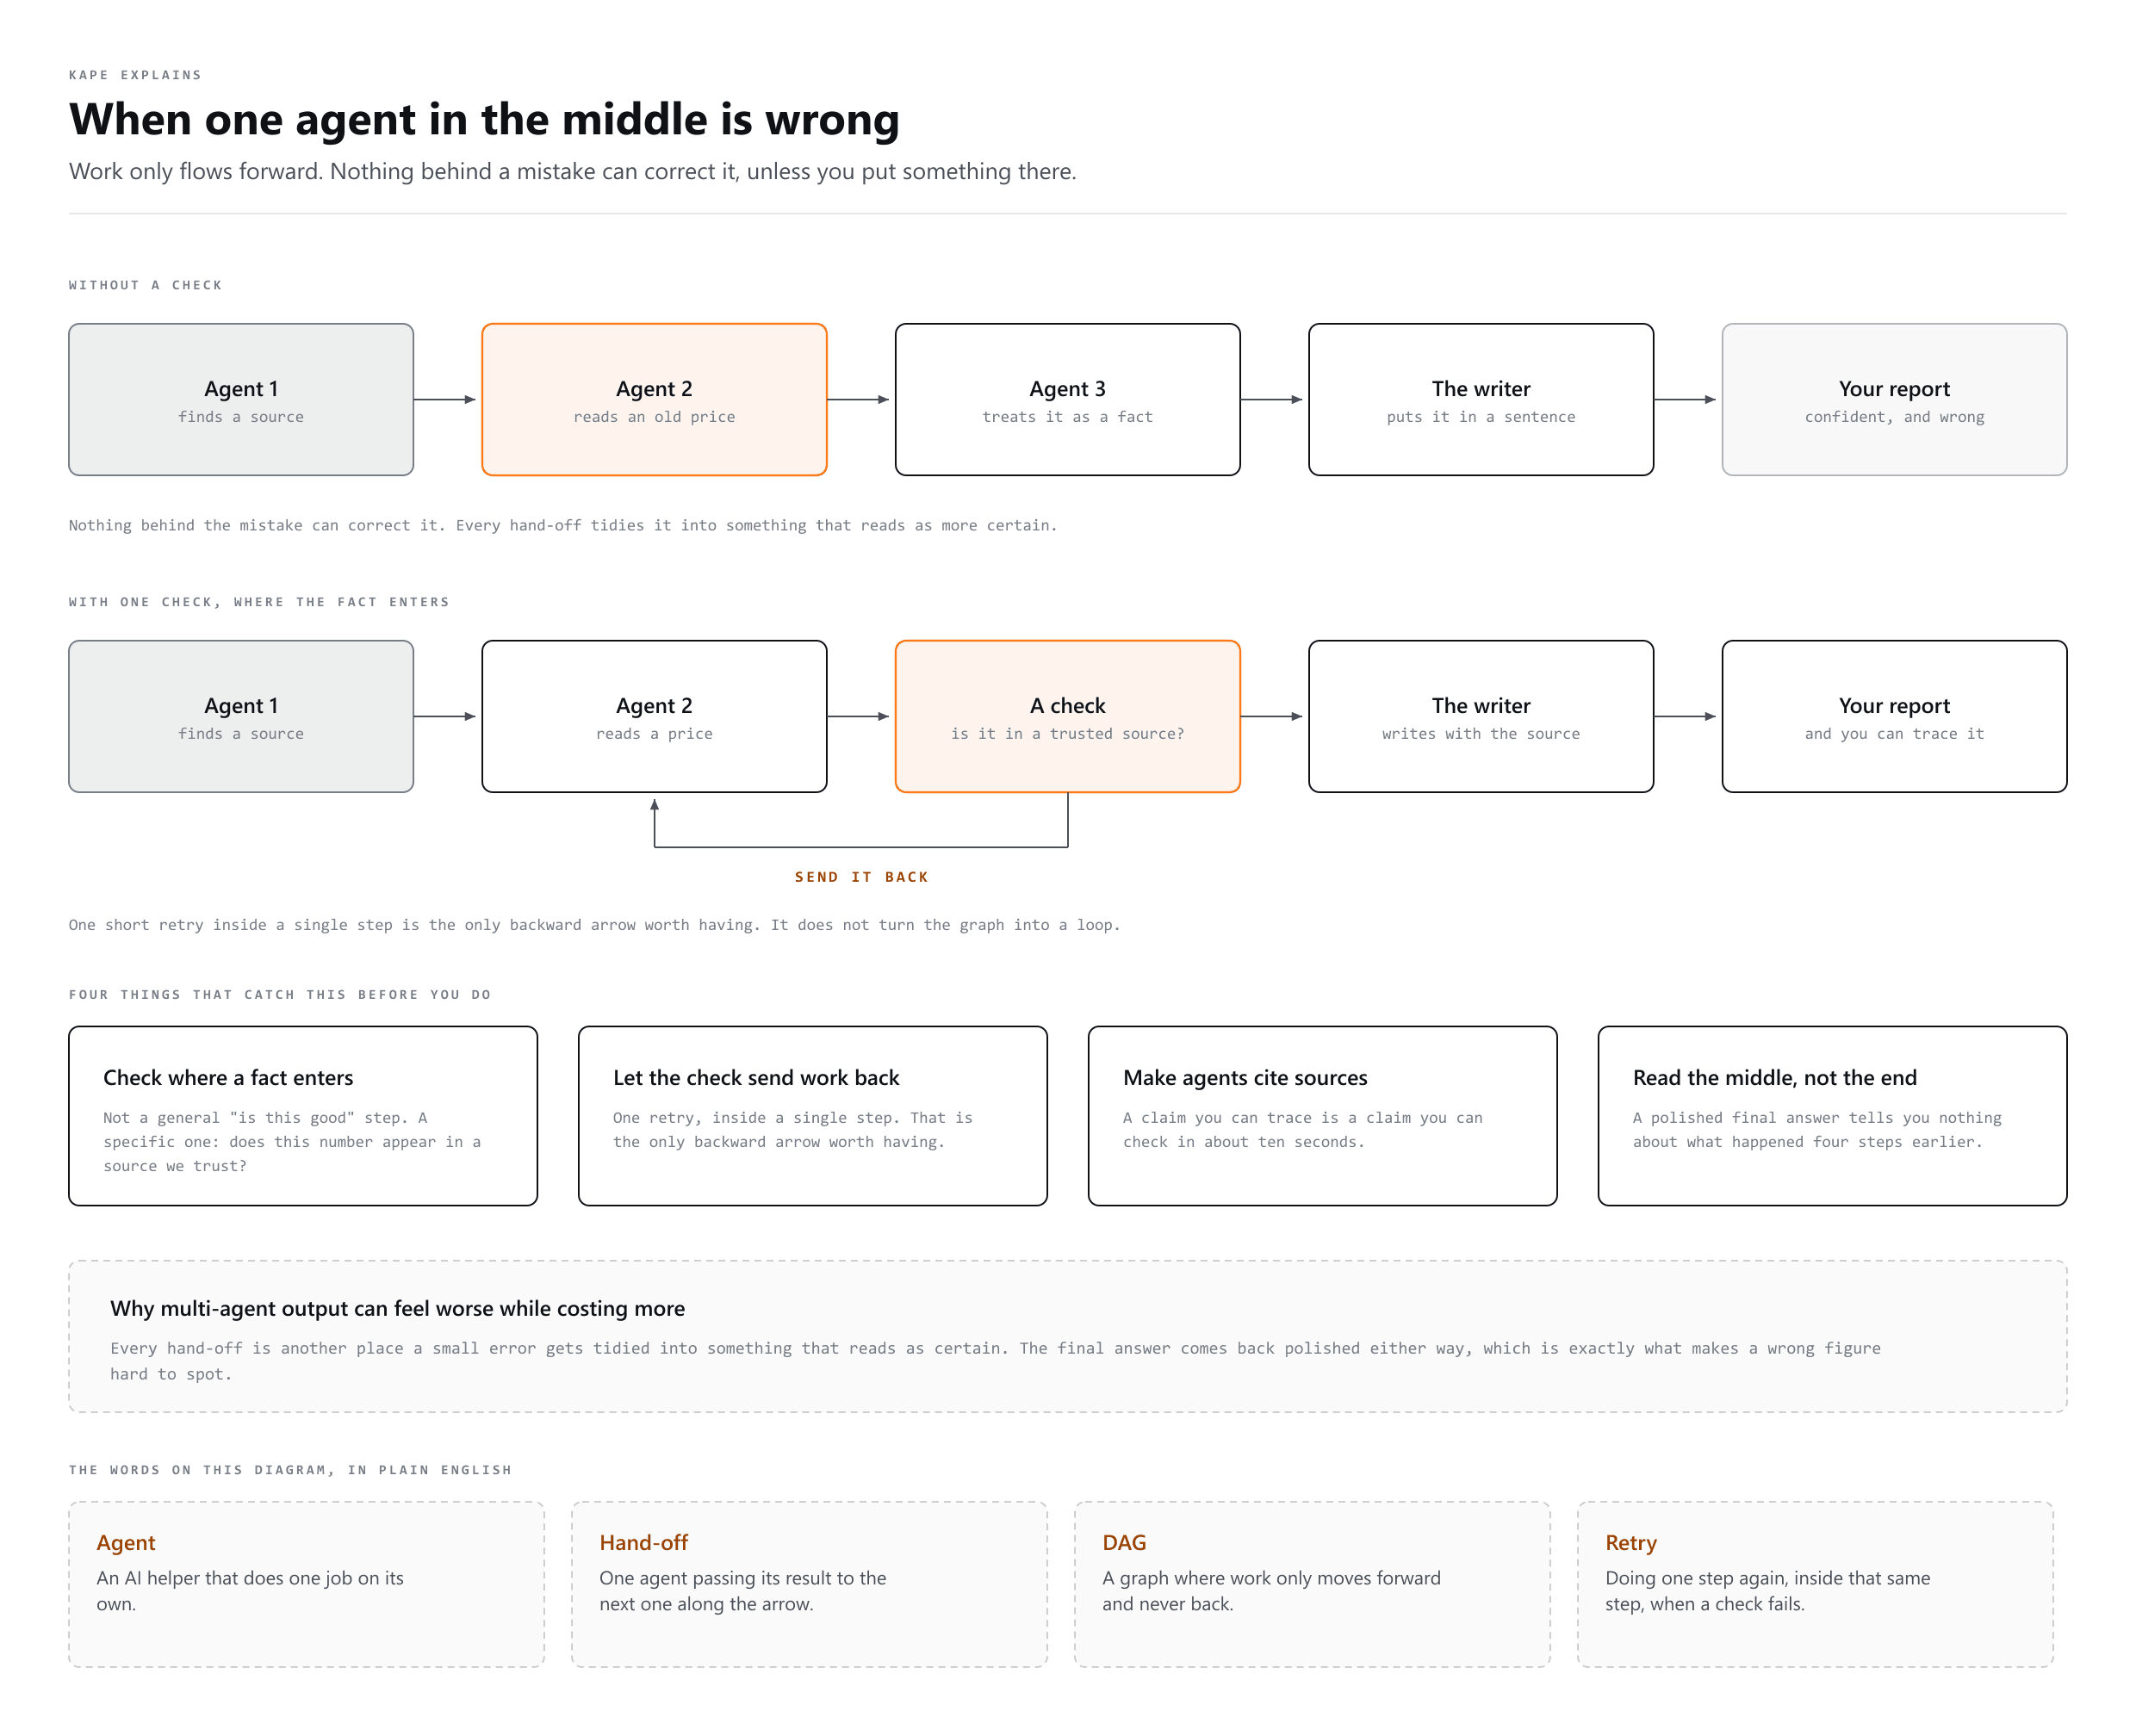
- Put a check where a fact enters. Not a general "is this good" step. A specific one: does this number appear in a source we trust?
- Let that check send work back. One short retry inside a single step is the only backward arrow worth having, and it does not turn the graph into a loop.
- Make every agent say where its facts came from. A claim you can trace is a claim you can check in ten seconds.
- Read the middle, not just the end. A polished final answer tells you nothing about what happened four steps earlier.
This is the practical reason multi-agent output can feel worse than a single chat while costing more. Every hand-off is another place a small error gets tidied into something that reads as certain.
Why it can cost more
Splitting work between many agents is not free. Each agent needs its own starting instructions before it can begin, and that uses tokens (the small pieces of text an AI reads and is billed for). One source from Anthropic, the company behind Claude, shared that a single agent working alone can use roughly four times more tokens than a normal chat conversation, and a full multi-agent system can use roughly fifteen times more tokens than a normal chat. In one real example, around 100 agents were used for a single research task, and each agent used about 20,000 tokens just to get started. Without any cost-saving tricks, that could add up to close to $10 for that one task. But with a trick called prompt caching, where repeated instructions are reused instead of being paid for again and again, the same task can cost closer to $1.
| Setup | Rough token use compared to a normal chat |
|---|---|
| Normal chat with one AI | 1x (the baseline) |
| One agent doing a full task alone | About 4x more tokens |
| A multi-agent graph system | About 15x more tokens |
A short history, in plain words
The idea of a graph is old. Back in 1736, a mathematician named Leonhard Euler looked at a city with two islands and seven bridges. People wondered if you could walk a route that crossed every bridge exactly once. Euler turned the islands into dots and the bridges into lines, and proved that no such route was possible. That simple trick, turning a real problem into dots and lines, became the start of graph theory. Many years later, around 2023, projects like Microsoft's AutoGen and LangChain's early work on connecting AI models picked up the same idea for AI agents working with each other. Back then, a single AI call was not smart or reliable enough to make these graphs very useful. Only recently, now that individual AI agents can use tools, browse files, and follow long instructions well on their own, has connecting many of them in a graph become genuinely useful.
When to use it, and when not to
- Use a multi-agent graph for big, complicated jobs that can be split into clear smaller parts, like deep research across many sources, or a big content project with several stages.
- Use a multi-agent graph when speed matters and the smaller parts can be done at the same time instead of one after another.
- Skip it for small, simple tasks. Asking one question, fixing one sentence, or summarising one short document does not need a team of agents. One agent, or a normal chat, is faster and cheaper.
- Skip it if you cannot clearly describe how the task should be split. A messy plan turns into a messy, expensive graph.
Common mistakes
- Using many agents for a task that one agent could have handled just as well. This wastes tokens and money for no real benefit.
- Not planning the order of work clearly, so agents end up waiting on each other instead of truly working at the same time.
- Forgetting that more agents usually means a bigger bill, because every agent needs its own starting instructions.
- Assuming a graph with loops going backward behaves the same as one that only flows forward. A one-direction graph (a DAG) is much easier to predict than one that can loop.
More words
- Prompt Engineering
Writing the instruction so the answer comes back right
- Context Engineering
Choosing what the AI gets to see while it answers
- Loop Engineering
Teaching an AI to check on its own, no prompt needed